Why is it SO difficult to measure Retention and Attrition accurately?

Despite much talk about its importance, we still have no accepted definition or standardised measure of retention
In 2000 the FIA commissioned a research programme and a series of reports (Winning the Retention Battle) designed to provide an industry definition of retention and an industry benchmark. Whilst the reports were warmly received, individual clubs and operators have, for a variety of reasons, been unable to compare their performance with others in the industry using the new model. Melvyn Hillsdon reports.
Background
At present, most UK clubs use the following formula to calculate attrition: the number of membership cancellations per month divided by the number of sales per month. For example, if 20 members cancelled in a month and 100 joined, the attrition rate would be 20%. The 12-month attrition rate is calculated by averaging these rates over a year.
If two clubs report the same attrition rate it would seem reasonable to assume that they were performing equally. But, because the existing model provides no information on the length of each individual‟s membership, it is entirely possible for two clubs to have identical 12-month attrition rates and perform very differently (because the average length of stay differs). Similarly, using the existing method, an 80% retention rate does NOT mean that 80% of the members stay at least 12 months. It simply shows that in a 12-month period there were 20% more sales than there were members who quit.
In the US, annual attrition is calculated by dividing the total cancellations in a 12-month period by the average number of „live‟ members in the same 12-month period. Although it is referred to as an annual attrition rate it does not mean for example that 50% of members quit within a year. It simply means that the number of members who quit within a 12-month period, expressed as a percentage of the average number of „live‟ members in the same period, is 50%.
Limitations
Beyond telling the sales team each month how many new members they need to get to replace the ones who have dropped out, both these methods of calculating attrition have limitations in terms of managing the retention and business side of a club.
Survival Analysis
This approach to measurement is used in the health sector for calculating time between events. For instance, waiting times, time until a complication occurs, or survival time following treatment. This powerful tool can be used for measuring any time-to-event where there is a start date, an event date (such as cancellation date), a follow-up date and a measure of whether the event (like a membership cancellation) has occurred or not.
Member Duration
The definition we use for the retention rate would be: "The proportion of members who remain a member for any predetermined time period e.g. 3 months, 6 months, 12 months etc.‟
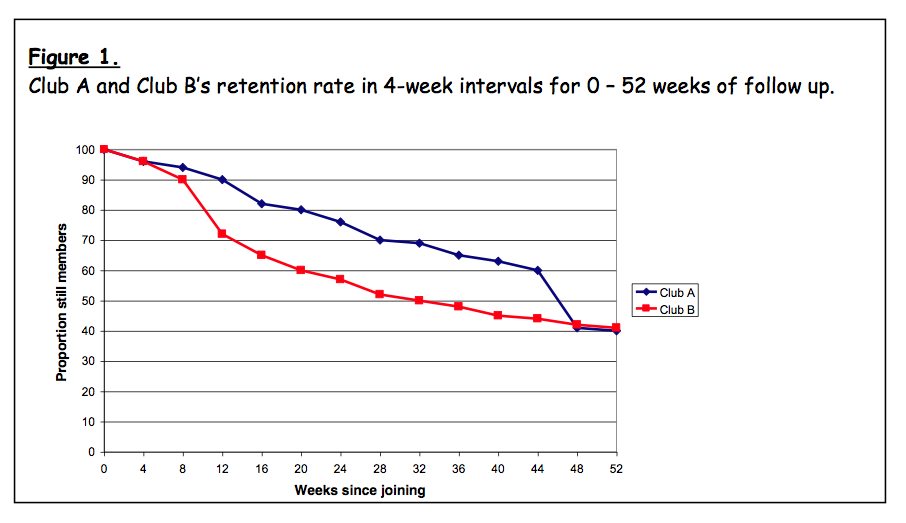
This can be reported graphically as shown in Figure 1. The horizontal axis on this graph shows the number of weeks since joining taking 0 as the start of a membership. The vertical axis shows the proportion of members who survive and do not cancel. The shape of the graph is as important as the proportion still paying at 52 weeks. Figure 1 shows that Club A and Club B have the same annual retention rate yet Club A clearly retains more members for longer and therefore makes more income from membership dues. If the graph is repeated for different time intervals, say years of opening, the curve may change. If for example, the early part of the curve is flatter, then early retention has
improved. Even if the proportion of people surviving at 52 weeks is the same (as in the example), it still means that more members are staying for longer before cancelling and therefore paying more in monthly dues. It is the area under the curve that is a driver of club revenues, and it is the area under the curve which clubs should aim to maximise. For companies with more than one club, a plot can be made for each club allowing for between club comparisons.
Attrition rate
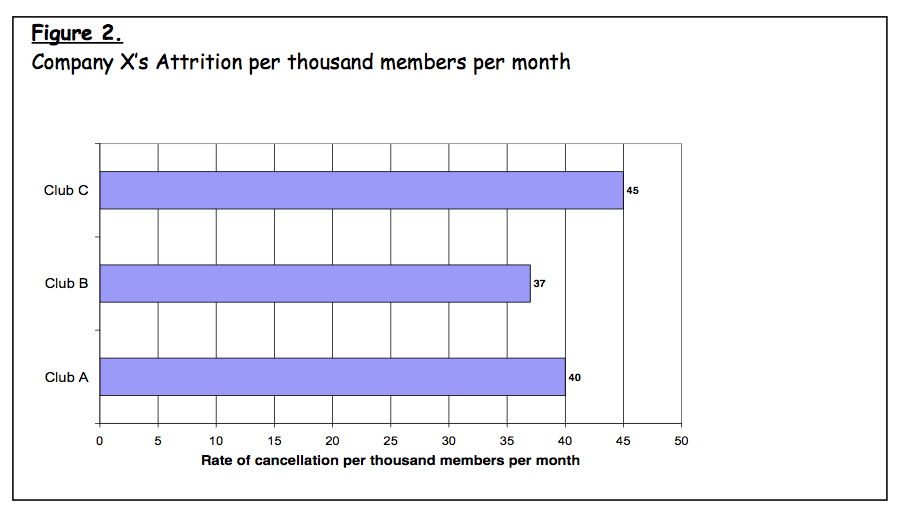
The definition I use for the mesaurement of the attrition rate would be “The number of membership cancellations per thousand members per month.”
This measure is sometimes referred to as the "churn rate‟. The churn rate gives an indication of the turnover of members. It can help guide sales teams, as it tells you how many members per thousand are being lost each month and therefore how many need replacing in order to maintain the membership base. It can also be used to benchmark clubs against each other, to enable learning and improvement to take place.
Compare the clubs in Figure 2. Assuming they all started the year with 1,000 members, Club C needs to recruit at a rate of 46 new members a month to maintain its 1,000 base compared to Club B which only needs to recruit 37. This also shows how closely linked sales and attrition are.
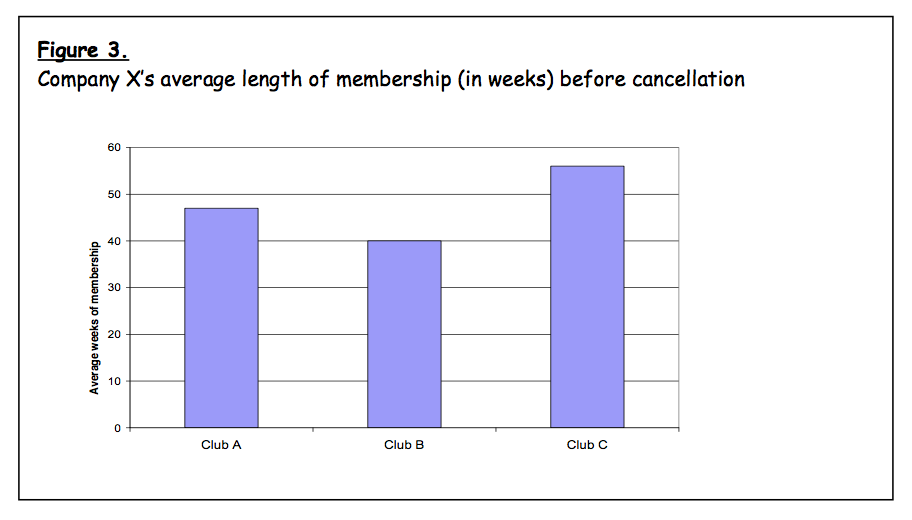
The definition used for the measuremnet of membership duration would be: “The average length of membership or the life span of a membership.”
The final measure of retention is the average length of membership or the life span of a membership. This is calculated using the data from survival analysis and it represents the average length of membership before a member cancels. The „average‟ reported is actually the median value – the exact middle value of the range of membership durations. So for example, if the median membership duration was 48 weeks, then half the members stay less than this and half stay longer.
This is a particularly useful measure as it can be used to help calculate an average income per member from membership dues, thus allowing revenue projections to be made. It can also be used to measure changes in retention. Imagine, for instance, how much extra income would be received if all new members paid an extra month before leaving.
All three of the above measures can be reported separately for other member characteristics such as age, sex, paid a joining fee or not, had a discount or not, type of membership, signed a contract or not, drive-time from club, etc. In fact they can be reported for any factor of interest that is held on the club‟s database. The measures can also be used to determine the effectiveness of any sales, promotion, customer care or retention initiative. Without such reliable feedback, it is very hard for organisations to learn what works, and discontinue ineffective initiatives. The minimum data fields required are:
- A unique membership ID
- The membership status
- The start date
- A cancellation date or "payment-stopped‟ date
Paul Bedford PhD
Retention Guru Ltd
.
Join our Free Retention Guru Community
This group is for those who want to increase retention, reduce attrition and improve the customer experience in a health club environment. It's here for you to share your wins, your challenges and your experiences. It’s here so that you can find support and be supportive.

8 most common mistakes operators make.
Simply enter your name and email to download your free copy today!